How Students Learn: Takeaways from Learning Analytics
Insights regarding the learning behaviour of students obtained by analysing data generated from the Plio platform.
Introduction
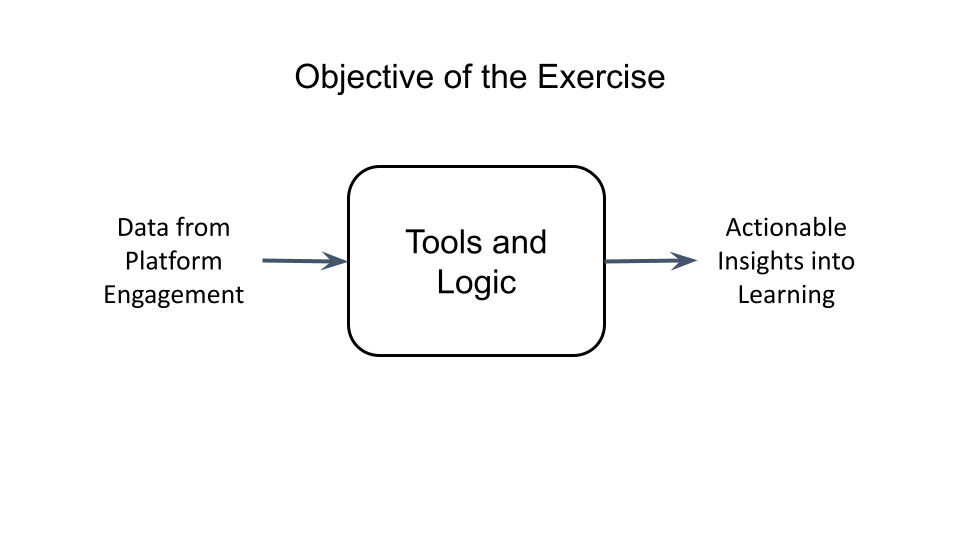
The last month and a half at Plio have been spent on (apart from all the cool stuff that usually happens here, of course 🙂) understanding the level and behaviour of learning of the students who engage with our platform. The idea was to utilise the engagement data being generated from our product platform and use it to visualise the impact it has had on how students learn. And what we learnt doesn’t disappoint.
Learnings
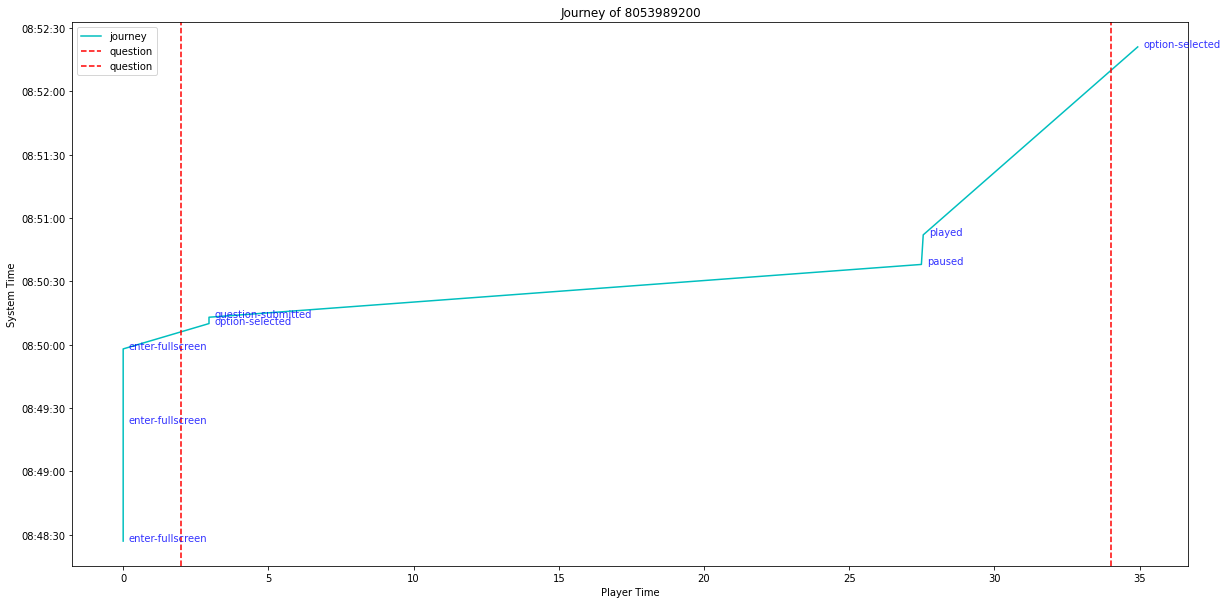
Everyone Learns a Different Way: Every time a student clicks anywhere while watching a Plio, they generate a data point telling us the when and what of that click. And a hundred such clicks by folks across the country are the reason we have precious clickstream data that gives us a glimpse into their learning patterns. We found many:
There were students who attempted the Plio in a linear fashion — watched the video and attempted questions as they came.
Some liked revising by dragging the content back a little before they took a shot at the questions.
Some just attempted the questions, while others decided to skip them all and just focus on the content.
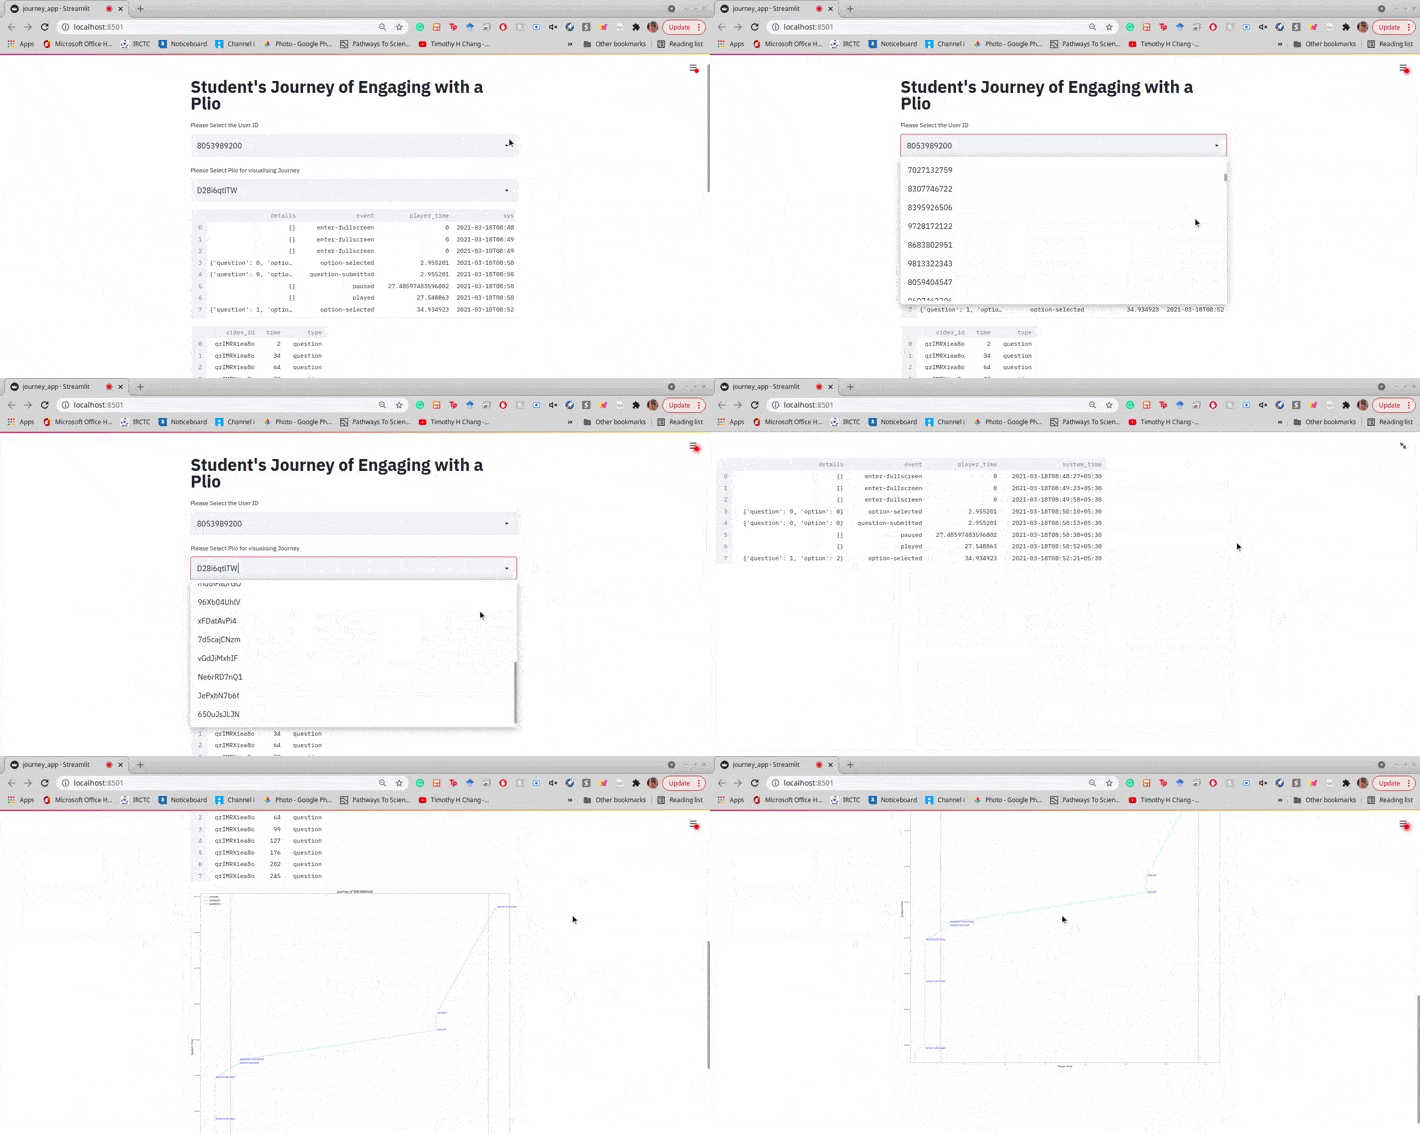
The list can go on and on, especially when there could be variations in how even a single user behaves at different times. During this, we found a set of users who are very interesting and hence have been named ‘Power Users’. They are students who engaged with the Plio platform consistently over the 12 weeks and comprise about 1.3% of the total user base. Needless to say, converting every user on Plio into a power user would make us happy, which is why we built a dashboard to better observe their behaviour.
The bird’s eye view of how power users behave is a story for another day.
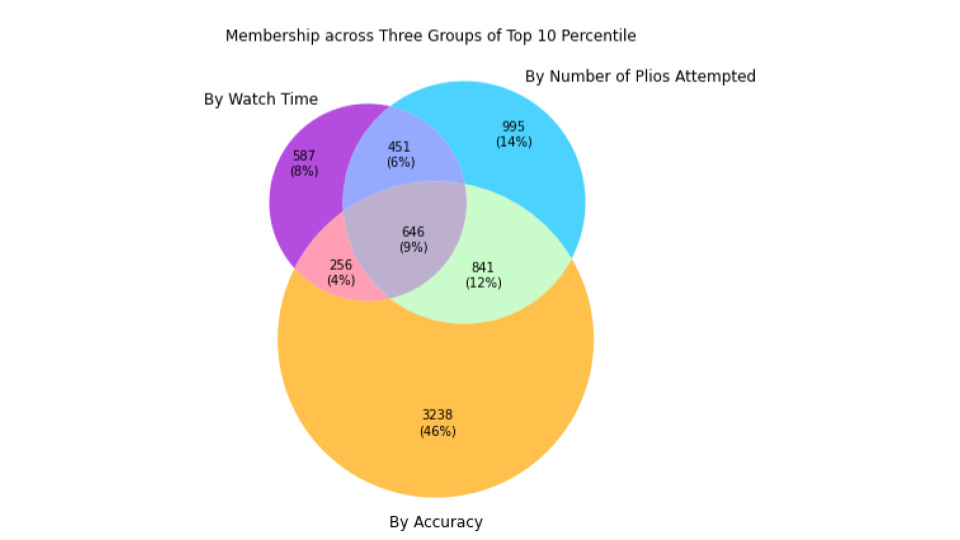
2. They come back, so it must be pretty good 😇 : In our analysis, we filtered students into various groups(cohorts) depending on factors like how many Plios they did, how long they watched the video for, percentage of questions they attempted and with what accuracy they attempted those questions. Different cohorts told us different things about the students. For instance, students in the cohort of top 10 percentile by ‘number of plios done’ showed an increase in the accuracy with which they answered questions and the extent to which they completed the Plio, while not recording any significant change in the time period for which they watched the content.
Furthermore, when we saw the overlap between students lying in different cohorts, we noticed that even users(6% of the three cohorts shown below taken together) who may not be able to answer questions very accurately spend some of the highest time watching the Plios and attempt a lot of them too. They are thus, quite persistent and choose to come back and engage with the platform because it’s not just about the score for them.
3. Flexibility is the forte: Studying with Plio is like attempting a Google Forms quiz with the added flexibility of referring just as much study material you need, as in an open book test. Upon receiving recurring evidence of the hypothesis that the watch time of Plios remains roughly the same regardless of when the Plio is released, but the completion rate and accuracy of attempting them increases, our analysis tells us that while Plio may not always serve as a primary learning tool, it is a more interactive and fun way of self-learning demonstrating an improvement in the performance of users. Plio thus gives students the flexibility to engage with only as much content as they wish to while motivating them to keep going.
Way Forward: Plio’s Potential as a Learning Tool
The intention is to ensure the growth of our stakeholders — in this context, the students. Insights can be translated into action in many ways:
Add features to the platform that incentivise watching more content.
Understand (and help the educators do the same) the learning behaviour at the student level to provide content and support accordingly.
Based on insights from learning behaviour, identify the students who are likely to drop off and re-engage them early enough. Eventually, take them to the power user level.
Conclusion
It is truly wonderful how so much can be extracted from the data around us. The power to create impact through the same must not be underestimated, especially in an era where we gravitate towards models that are largely uninterpreted. The work described here is evidence of the same.
The Story Matters
This hit me when asking the team about how Plio was conceptualised — how this pool of people got together and decided to build Plio, matters.
The Story Matters.
It matters because it drives their work to democratise education and create a positive impact — something I got to experience first-hand in the capacity of a Data Scientist intern in the team. My takeaways through this experience have been many, but just to name a few:
Placing the stats into context to generate insights that are understandable by all.
Writing code that can be reused efficiently by others.
A great example of how work culture in an organisation can create all the difference in how you contribute to that organisation’s work (believe me, the standards have been set quite high 🙂).
Thanks for reading!


Amazing work!
Great work Keerat!